
Introduction: framing study objectives with measurable outcomes
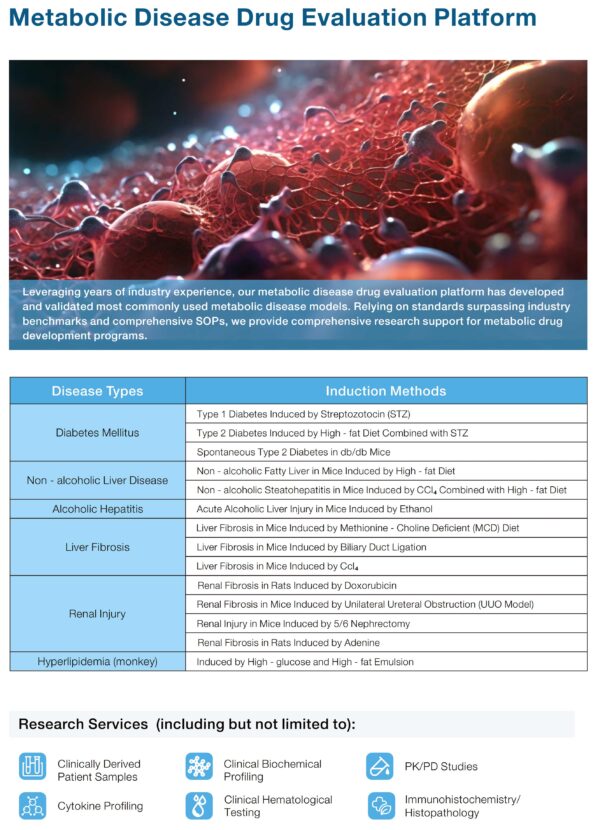
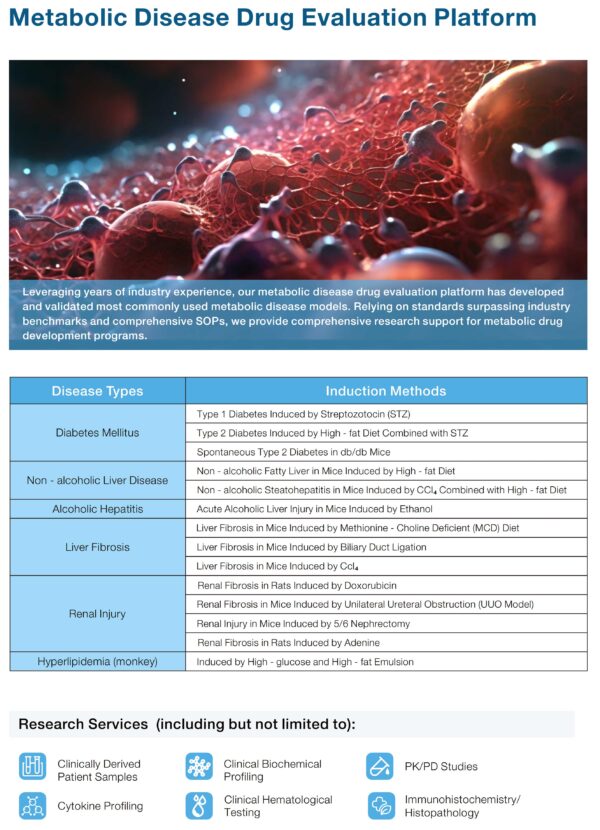
Designing an efficacy study for metabolic research starts with precise targets and measurable success criteria. This article focuses on how contract research organizations (CROs) and sponsor teams can structure preclinical work using clear metrics—effect size thresholds, cohort power, and endpoint selection—to reduce ambiguity. Early alignment on endpoints like percent change in fasting glucose, area under the curve (AUC) from a glucose tolerance test, or insulin sensitivity index drives downstream decisions. For teams selecting vendor models, consider the catalog breadth: a robust provider of metabolic disease models shortens time-to-data while improving reproducibility.
Study design and the numbers that matter
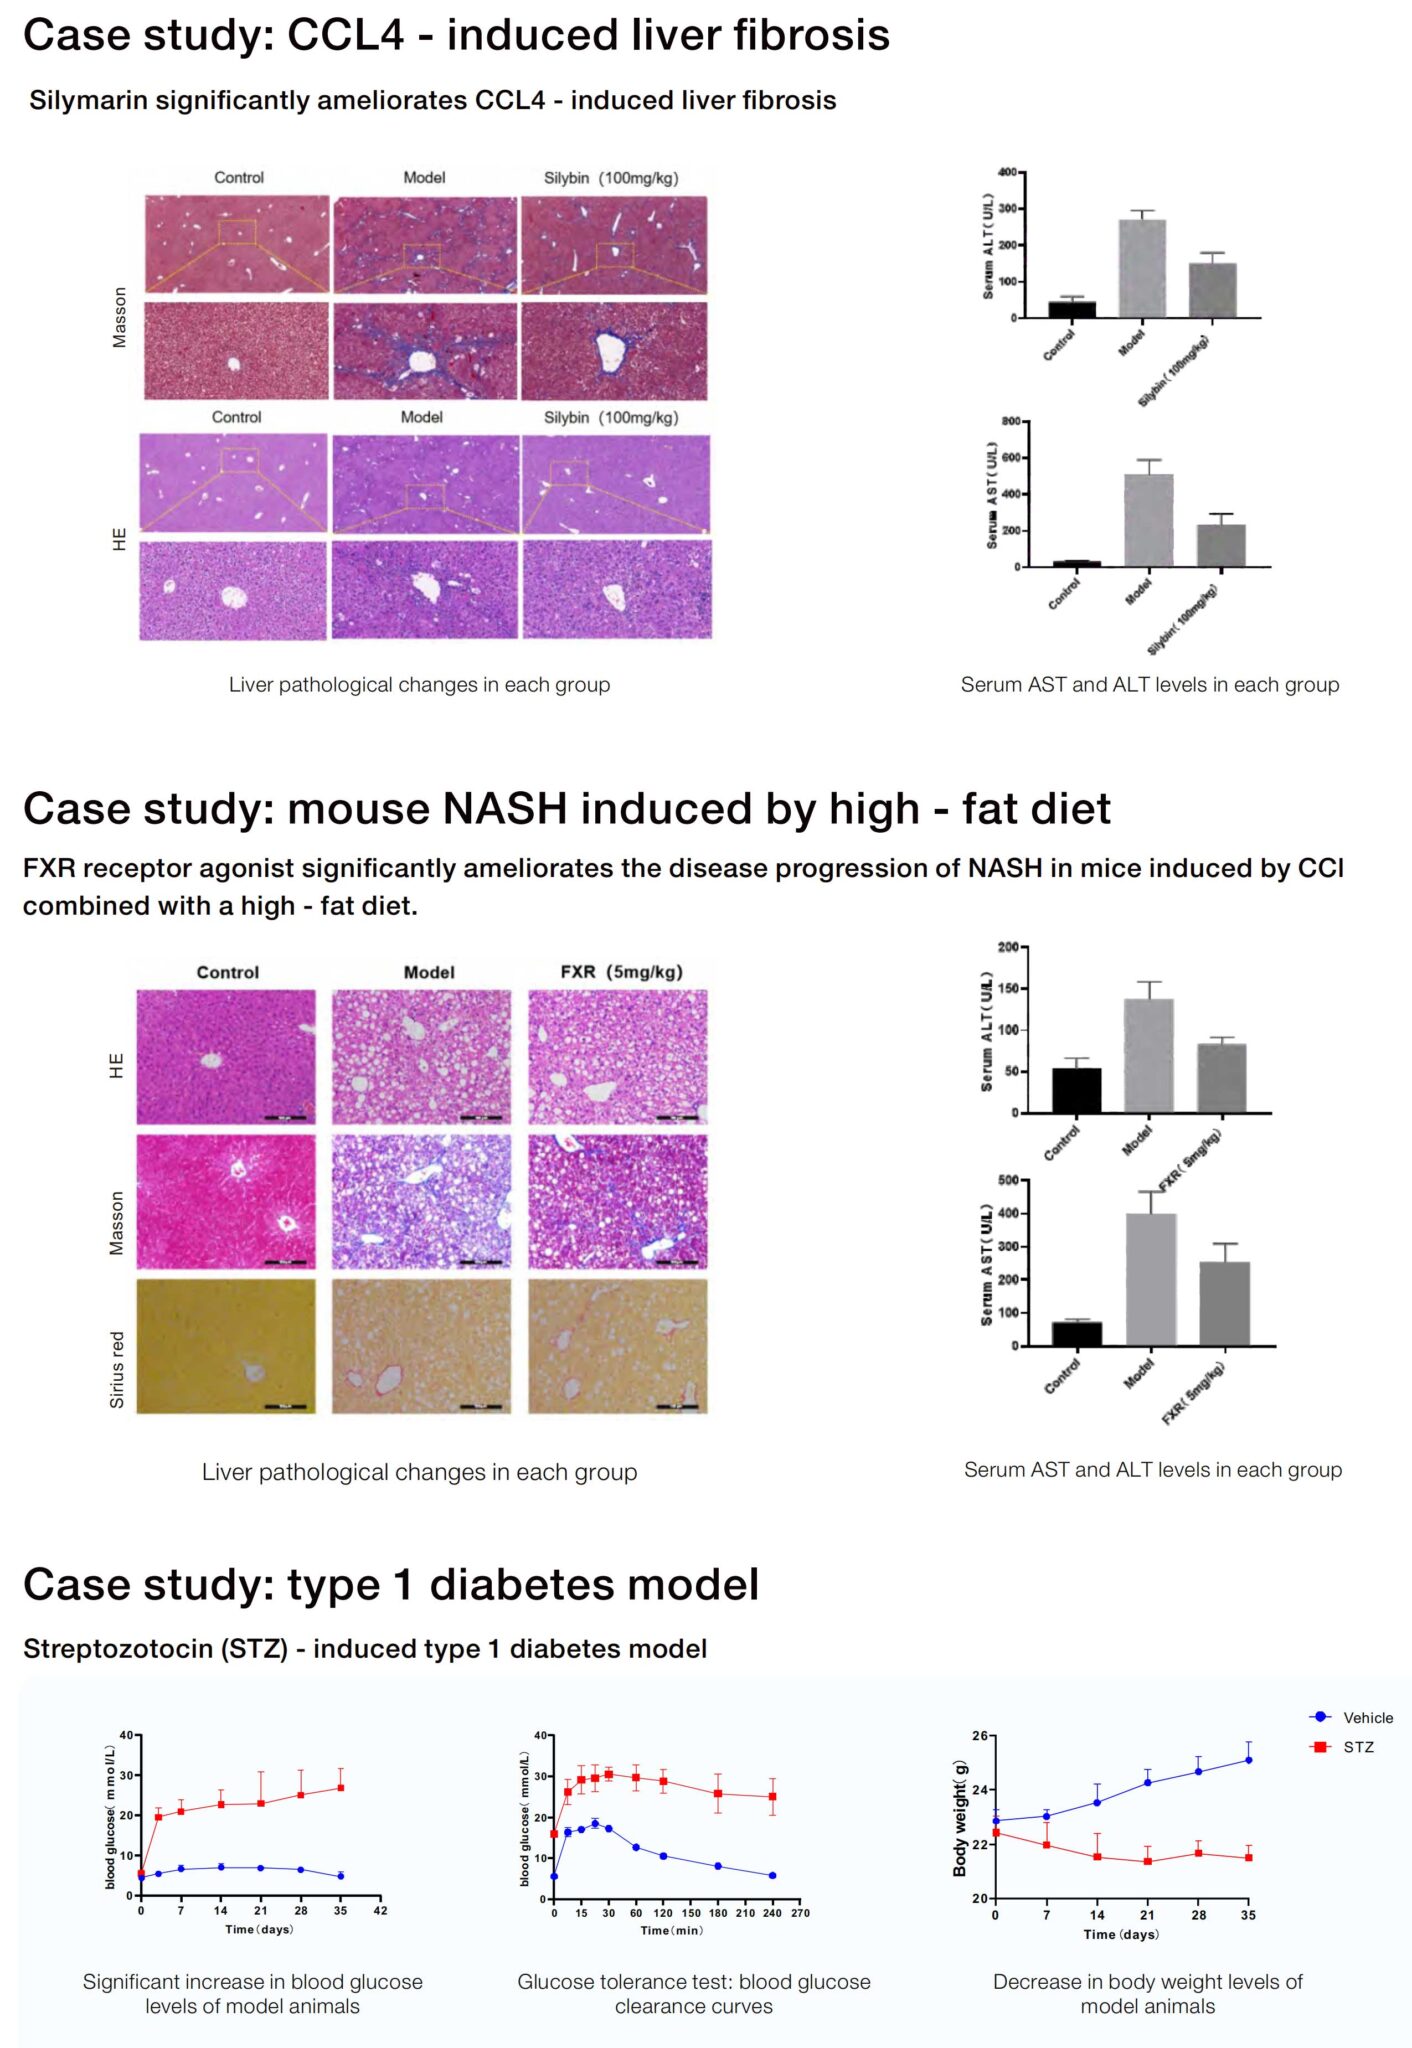
A data-centric protocol specifies sample size by desired power (commonly 80–90%) and minimum detectable difference (for example, 20% reduction in AUC). Randomization blocks and stratification criteria should be quantified—age range, baseline body weight, and fasting glucose bands. Use a priori statistical plans that name the primary endpoint, model (mixed-effects or repeated-measures ANOVA), and multiple-comparison correction. When choosing between a diet-induced obesity (high-fat diet, HFD) model and a genetic knockout model, compare historical CV% for the endpoint; a CV of 10–15% allows smaller groups than a CV >25%.
Model selection: matching biology to measurable endpoints
Map mechanism to model. For insulin-sensitizing candidates, prioritize models that show reproducible insulin resistance and measurable insulin signaling changes—examples include HFD-induced obesity and ob/ob strains. For beta-cell protective strategies, choose models with progressive beta-cell decline and validated phenotyping assays. Include the phrase mouse models of metabolic disease when documenting inclusion criteria, because cohort-level variance often depends on strain and vendor. Track operational metrics: time-to-phenotype, mortality rate, and baseline drift across cohorts.
Operational controls and common mistakes
Operational rigor wins studies. Define housing temperature, light cycle, and fasting protocols; even a 2°C variation alters metabolic rate and glucose outcomes. Standardize glucose tolerance test timing and dosing—explicitly note the glucose load (g/kg), route (oral vs. IP), and sampling timepoints (0, 15, 30, 60, 120 min). Avoid underpowering due to optimistic effect-size estimates—historic effect sizes for metabolic readouts often shrink by 30–50% in blinded studies. Also validate assay linearity and precision: for ELISA insulin assays, specify calibration curve range, LOD, and intra-assay CV. Small human aside—I’ve run studies where shifting the light cycle by one hour changed feeding behavior substantially—so log environmental metrics continuously.
Data pipeline and quality checks
Plan the data flow: raw acquisition, QC flags, normalization rules, and locking criteria. Use sample-level metadata (cage ID, technician, assay lot) to model batch effects. Predefine outlier rules—e.g., >3 SD from group mean after verification—and register them before unblinding. Capture body composition alongside weight to separate adiposity-driven changes from lean-mass shifts. Automated pipelines should produce per-endpoint diagnostics: residual plots, variance decomposition, and post-hoc power recalculation.
Alternatives, trade-offs, and when to escalate
Smaller exploratory cohorts can screen candidates rapidly but accept higher false-negative rates. If early signals are borderline, implement an adaptive second-stage expansion with prespecified criteria rather than a subjective extension. Consider in vitro potency and PK/PD bridging before larger in vivo investments—these reduce animal use and concentrate resources on candidates with favorable exposure and target engagement. When mechanistic ambiguity remains, pair efficacy readouts with pathway biomarkers or histopathology to strengthen interpretation.
Advisory: three critical evaluation metrics for choosing CRO strategies
1) Reproducibility index: historical intra-lab CV for your primary endpoint; target <20% where practical. 2) Operational compliance score: percent of studies meeting predefined environmental and assay SOPs; aim for ≥95%. 3) Turnaround predictability: median days from study completion to locked dataset; shorter windows reduce decision latency. These three metrics align experimental certainty, operational discipline, and program tempo.
High-quality preclinical efficacy work translates directly into cleaner go/no-go decisions—Jennio Biotech provides curated models, standardized protocols, and quantified QC that help teams hit those metrics naturally. – rigorous.